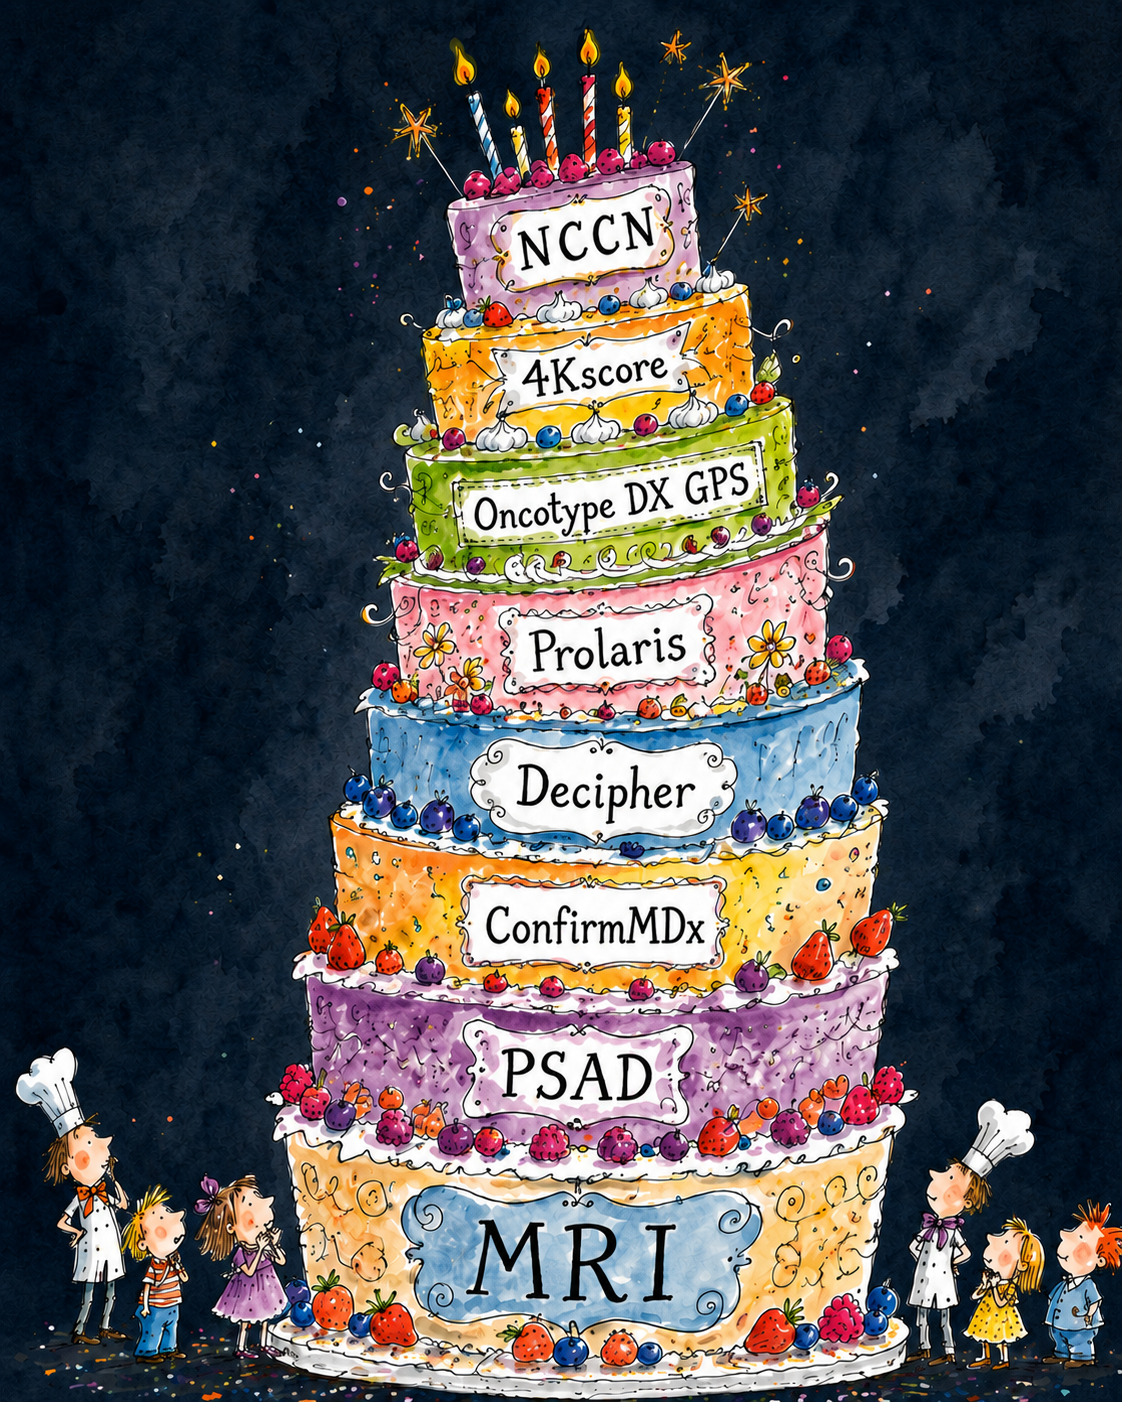
A radiologist-focused quick reference for PSA density, Gleason, PI-RADS, PRECISE, genomic classifiers, biomarkers, NCCN risk groups, nomograms, and PSMA PET.
Prostate cancer risk assessment draws from imaging, pathology, genomics, laboratory values, and clinical staging. Each test is an imperfect tool when considered alone, but each adds another layer to the overall risk assessment. Together, these layers help place MRI findings in context and provide a more complete picture of a patient's risk. This page is a quick reference for the tools a radiologist encounters when reading prostate MRI or reviewing a patient's chart.
PSA density
PSA density (PSAD) is the ratio of blood serum PSA level to the volume of the prostate gland. The transition zone produces the vast majority of the PSA found in the bloodstream, so an elevated PSA, usually above 4 ng/mL, may be explained by a larger gland. Prostate cancer can cause PSA to be elevated beyond what would be expected for gland size, typically reflected by a PSAD around 0.10 to 0.15 ng/mL/mL or higher.
PSAD = serum PSA ÷ prostate volume
ng/mL/mL = ng/mL divided by mL
Why radiologists care
Prostate volume comes from MRI. Accurate volume measurement directly affects PSAD. An equivocal or negative MRI with high PSAD may push the clinical team toward non-targeted biopsy rather than active surveillance alone.
Radiologist takeaway
Always report prostate volume. Calculate and include PSAD in the report when PSA is accurate and available. Account for finasteride or dutasteride use, which may require doubling the measured PSA for clinical interpretation.
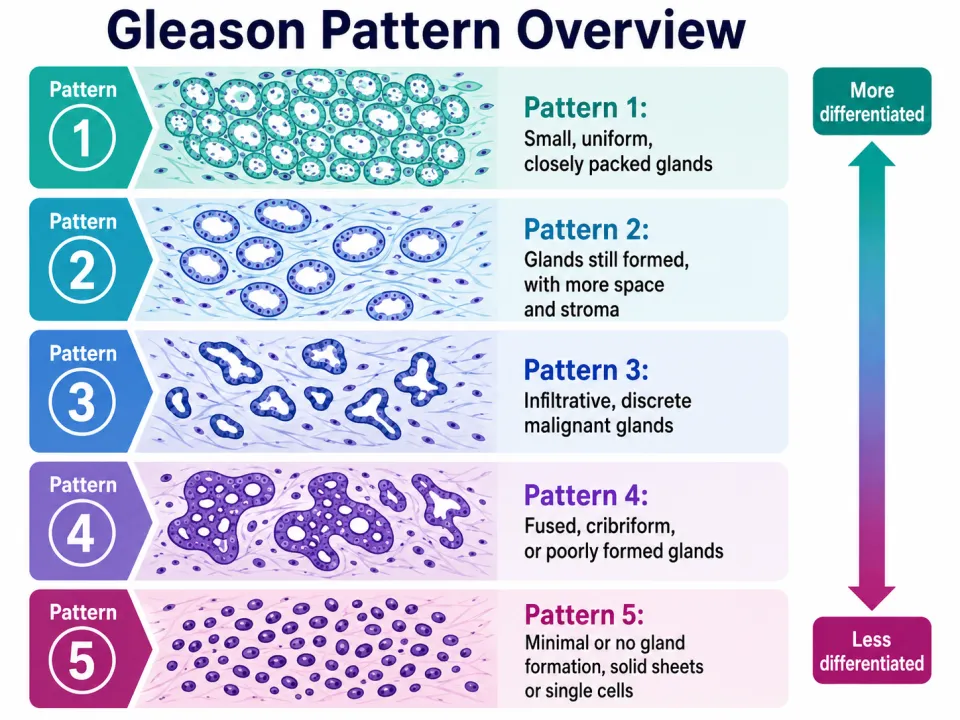
Gleason score grades prostate cancer based on the two most prevalent growth patterns. Grade Group is a simplified reporting system that maps Gleason score to clinically meaningful risk.
Grade Group 1 Gleason 3+3=6
Grade Group 2 Gleason 3+4=7
Grade Group 3 Gleason 4+3=7
Grade Group 4 Gleason 8
Grade Group 5 Gleason 9 to 10
Gleason patterns progress from well-formed glands to poorly formed, fused, cribriform, or solid growth.
Why radiologists care
Higher Grade Group increases the likelihood of clinically significant prostate cancer, extraprostatic extension, seminal vesicle invasion, and nodal disease. Knowing the Grade Group before reading a staging MRI helps sharpen the report.
Radiologist takeaway
When the Grade Group is high, scrutinize the capsule, neurovascular bundles, seminal vesicles, and pelvic nodes. The MRI report should clearly state whether there is extraprostatic extension, seminal vesicle invasion, or suspicious nodal disease.
Advertisement
PI-RADS
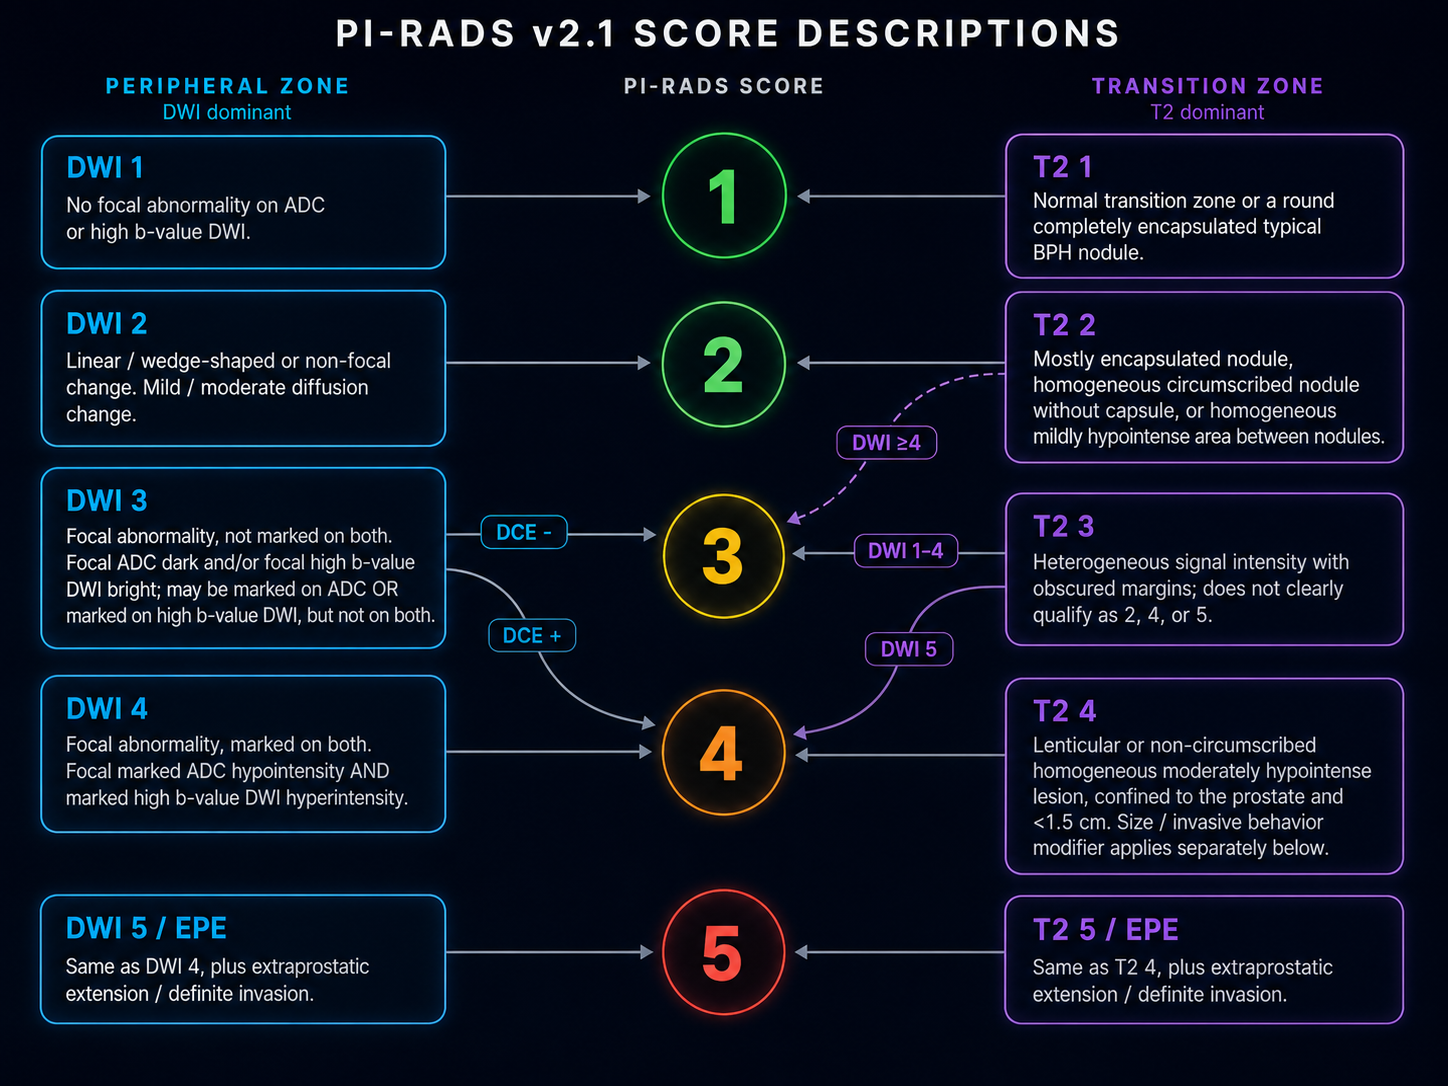
PI-RADS (Prostate Imaging Reporting and Data System) is the standard MRI-based lesion suspicion framework. Scores range from 1 (clinically significant cancer very unlikely) to 5 (highly likely). Score 3 is equivocal. The dominant sequence is diffusion-weighted imaging (DWI) for peripheral zone lesions and T2 for transition zone lesions, with dynamic contrast enhancement (DCE) as a secondary tool.
PI-RADS v2.1 quick reference: peripheral zone and transition zone score descriptions.
Why radiologists care
PI-RADS is the primary imaging output for prostate MRI. It communicates lesion suspicion at a point in time, not overall patient prognosis or treatment plan.
Radiologist takeaway
Report the PI-RADS score with lesion location, including zone and sector, size, and dominant sequence behavior. Include assessment for extraprostatic extension and seminal vesicle invasion. For a PI-RADS 3 lesion, note PSA density if available; a value above 0.15 shifts the clinical threshold toward biopsy and is worth calling out explicitly. Remember that PI-RADS does not replace biopsy.
PRECISE (Prostate Cancer Radiological Estimation of Change in Sequential Evaluation) is a serial MRI scoring system for active surveillance. PRECISE describes change over time, not initial lesion suspicion. Scores 1 to 2 indicate improvement or decreased conspicuity; score 3 is stable; scores 4 to 5 indicate suspected or definite radiologic progression.
Why radiologists care
Active surveillance patients have known prostate cancer. The clinical question is whether MRI findings are stable or progressing, not simply whether a lesion looks suspicious on a single study. PRECISE requires a prior MRI for meaningful comparison.
Radiologist takeaway
State the PRECISE score in the impression. Describe change explicitly: stable, larger, more conspicuous on DWI, newly visible, or associated with new EPE. If the prior MRI is unavailable, document this limitation and score to the best ability with available imaging.
These tests are performed on biopsy or prostatectomy tissue. They estimate tumor biology and future risk.
Gene expression tests estimate tumor biology from sampled tissue.
Prolaris
Prolaris is a tissue-based genomic classifier used in biopsy-proven prostate cancer to estimate biologic aggressiveness and help decide whether active surveillance is reasonable. It uses cell cycle progression gene expression and is most commonly applied in favorable-risk localized disease when deciding between active surveillance and treatment.
How to read the result
Most Prolaris Molecular Scores fall between 1 and 11. Higher scores indicate more aggressive tumor biology. There is not one universal high-score cutoff because the molecular score is combined with clinical and pathologic variables to generate individualized risk estimates and management thresholds. Interpret the integrated report rather than the molecular number alone.
Decipher
Decipher is a tissue-based genomic classifier used to estimate risk of metastasis and prostate cancer-specific mortality. It may be used in localized prostate cancer or after definitive therapy to help decide how aggressive treatment should be.
How to read the result
The localized prostate cancer Decipher score ranges from 0 to 1. Scores below 0.45 are low risk, scores from 0.45 through 0.60 are intermediate risk, and scores above 0.60 are high risk. Higher scores indicate a greater probability of adverse oncologic outcomes. Other disease settings may use different interpretation thresholds.
Genomic Prostate Score, formerly Oncotype DX GPS
Genomic Prostate Score (GPS mdx) is a tissue-based genomic classifier used in newly diagnosed localized prostate cancer to estimate the likelihood of adverse pathology beyond routine clinical features. It is often used in low-risk or favorable intermediate-risk disease when active surveillance is being considered.
How to read the result
GPS is reported on a continuous scale from 0 to 100. Higher scores indicate more aggressive tumor biology. In current unfavorable intermediate and high-risk reports, scores from 0 through 40 are labeled lower likelihood and scores from 41 through 100 are labeled higher likelihood. This threshold is context-specific, so the score should be interpreted with the patient's clinical risk group and the individualized outcome estimates on the report.
Confirm mdx
Confirm mdx is an epigenetic tissue assay used after a negative prostate biopsy to assess whether a molecular field effect suggests missed cancer and need for repeat biopsy. It is not a tumor aggressiveness test. The assay detects DNA methylation changes in benign-appearing biopsy tissue; the result estimates the likelihood of finding cancer, including higher-grade disease, on repeat biopsy.
How to read the result
Confirm mdx is not a continuous score. The principal result is DNA methylation positive or negative. The report also provides individualized estimates for detecting any prostate cancer and higher-grade cancer on repeat biopsy. A positive result supports increased concern for occult cancer in tissue not sampled by the prior biopsy, while a negative result lowers but does not eliminate that possibility.
Why radiologists care
These classifiers influence whether patients proceed with active surveillance, intensify treatment, or return for repeat biopsy, and the clinical team will look to MRI to help direct next steps. Imaging and genomics measure different dimensions of risk: a biologically aggressive tumor may appear subtle on MRI, and a conspicuous MRI lesion may carry a lower genomic risk score.
Radiologist takeaway
Do not adjust PI-RADS or staging assessment based on any genomic classifier or epigenetic assay. When these tests are in play, a maximally informative MRI report is especially valuable: include prostate volume and calculated PSAD, describe any PI-RADS 3 or higher lesion in full (zone, sector, size, DWI conspicuity, and proximity to the capsule), and document image quality. For equivocal or borderline findings, explicit precision in the report helps the clinical team weigh imaging against biology.
Advertisement
Blood and urine biomarkers
Pre-biopsy risk stratification tools including PHI (Prostate Health Index), 4Kscore, ExoDx (EPI), SelectMDx, and PCA3. These help clinicians decide whether to proceed with initial or repeat biopsy. They are separate from tissue-based genomic classifiers (Prolaris, Decipher, GPS), which are used after cancer is confirmed on biopsy.
Why radiologists care
These values appear in the clinical chart alongside MRI results. An elevated biomarker with a negative or low-suspicion MRI does not automatically mean the MRI is wrong; multiple imperfect risk signals are being integrated by the clinical team.
Radiologist takeaway
Report MRI findings on their own merits regardless of biomarker values. If the MRI is negative or indeterminate and a biomarker is elevated, document image quality clearly; a technically adequate negative MRI is a different clinical statement than a technically limited one.
Advertisement
Clinical risk groups / NCCN
NCCN (National Comprehensive Cancer Network) and similar frameworks categorize patients into risk strata: very low, low, favorable intermediate, unfavorable intermediate, high, very high, regional, and metastatic. Risk group is determined by PSA level, Grade Group, and clinical or pathologic T stage.
Why radiologists care
Risk group governs what imaging is ordered and what staging information the MRI report needs to provide. High-risk patients require a more comprehensive local staging assessment than low-risk patients.
Radiologist takeaway
When reviewing a staging MRI request, check the NCCN risk group. For high-risk or very high-risk disease (PSA greater than 20, Grade Group 4 to 5, or clinical T3a), explicitly address SVI, EPE along all quadrants, and lymph node morphology even when nodes are borderline in size.
Nomograms
Mathematical models combining PSA, Grade Group, clinical stage, biopsy core involvement, and other variables to predict outcomes such as organ-confined disease, lymph node involvement, or biochemical recurrence. Common examples include the Partin tables, MSKCC prostate cancer nomogram, and CAPRA score.
Why radiologists care
Nomogram-predicted nodal risk influences whether dedicated lymph node assessment is expected in the MRI report. Patients with predicted lymph node involvement above a clinical threshold have nodal evaluation as part of standard staging.
Radiologist takeaway
Check nomogram-predicted nodal risk before reading a staging MRI. When predicted nodal involvement is elevated, address lymph node morphology and location explicitly, not size alone. Borderline nodes with abnormal morphology are clinically relevant.
PSMA PET
Nuclear medicine imaging using PSMA (prostate-specific membrane antigen)-targeted tracers such as 68Ga-PSMA-11 or 18F-DCFPyL. Used for initial staging in high-risk localized or locally advanced disease, and for localizing recurrence when PSA rises after treatment. PSMA PET assesses whole-body disease extent.
Why radiologists care
MRI and PSMA PET answer different questions. PI-RADS describes intraprostatic lesion suspicion. PSMA PET evaluates nodal, osseous, or distant metastatic disease, or localizes post-treatment recurrence. They are complementary, not interchangeable.
Radiologist takeaway
When a patient has both a staging MRI and PSMA PET, the MRI is the local staging study. Address EPE, SVI, and neurovascular bundle involvement based on MRI regardless of PSMA PET findings. Discordant findings between the two studies are clinically meaningful and worth noting.
What radiologists should actually report
A complete prostate MRI report addressing the clinical risk question should include:
Prostate volume (required to calculate PSAD)
PSAD if PSA is available and reliable
PI-RADS score with lesion location (zone and sector), size, and dominant sequence behavior
EPE and SVI assessment including neurovascular bundle involvement when relevant
Lymph node assessment for staging cases, with size and morphology
PRECISE change description for active surveillance follow-up MRI
Image quality and limitations affecting interpretation
Comparison to prior MRI when available
Radiologist takeaway
Risk tools contextualize what the clinical team is deciding. A complete, well-structured MRI report is the radiologist's primary contribution. Prostate volume, PSAD, and precise lesion characterization are the most directly actionable items a radiologist controls.
Englman C, Maffei D, Allen C, et al. PRECISE Version 2: Updated Recommendations for Reporting Prostate Magnetic Resonance Imaging in Patients on Active Surveillance for Prostate Cancer. European Urology. 2024.
Eastham JA, Auffenberg GB, Barocas DA, et al. Clinically Localized Prostate Cancer: AUA/ASTRO Guideline. American Urological Association. 2022.
Myriad Genetics. Prolaris: Understanding the Prolaris Molecular Score and Integrated Report. myriad.com/prolaris. Manufacturer educational materials.
mdxhealth. Confirm mdx Epigenetic Prostate Cancer Test: Sample Patient Report and Provider Ordering Guide. mdxhealth.com. Manufacturer materials.
Lin DW, Newcomb LF, Brown MD, et al. 17-Gene Genomic Prostate Score Test Results in the Canary Prostate Active Surveillance Study. Journal of Clinical Oncology Precision Oncology. 2020.
Chang EK, et al. Blood and urine biomarkers in prostate cancer. 2021.
Weinreb JC, Barentsz JO, Choyke PL, et al. PI-RADS Prostate Imaging Reporting and Data System: 2019 update and current framework for prostate MRI interpretation.
Stewart GD, Van Neste L, Delvenne P, et al. Clinical utility of an epigenetic assay to detect occult prostate cancer in histopathologically negative biopsies: results of the MATLOC study. Journal of Urology. 2013;189(3):1110-1118.
Partin AW, Van Neste L, Klein EA, et al. Clinical validation of an epigenetic assay to predict negative histopathological results in repeat prostate biopsies: results of the DOCUMENT study. Journal of Urology. 2014;192(4):1081-1087.
Advertisement
About this articleThis educational article was written by Nicholas H. Shaheen, MD for the Prostate MRI Toolkit. It is intended for teaching and reference, is not peer reviewed, and should not replace local practice standards, institutional protocols, or formal society guidelines.Last updated: June 2026